1. In BIDS, the SSIS project contain 10
packages. But How to deploy only 5 packages in Destination machine
eventhough Manifest file contains all 10 packages after the Build?
-Open the Manifest file in any editor like BIDS or Notepad, keep the required 5
packages, remove remaining 5 packages.
-Save and Close the Manifest file.
-Double click on Manifest file to deploy the required 5 package.
2. How would you pass a Parent variable value to Child Package?
We can pass the parent variable to child package by using Package
configuration: Parent Package Variable.
2.1 Create parent variable
FilePath - Parent - String -
C:\RK\file.txt
2.2 Drag an 'Execute Package Task' in Control Flow and configure it to start
child package.
2.3 Go to Child Package and create a variable with same name as your parent
package variable.
2.4 Add Package configurations
2.5 "Enable Package Configuration", choose Configuration type as
"Parent Package Variable" and type the name of the variable.
2.6 click 'Next' button and select the 'Value' property of the child package
variable.
2.7 click 'Next' and 'OK' buttons
2.8 To test the package, I added sample Script Task with a messageBox to show
the value of the parent package.
3. My Source
Table data as follows:
Output Should
be as follows:
How to
Implement?
Designed SSIS package like:
The script component code:
4. My Source
Table Data as follows:
Output should
be as follows:
How to Implement?
5. The data
in the Flat File as follows:
"132","Ramakrishna"," " ,"Hyderabad"
"132","Radhika","17","Vangara"
How to remove double quotes from the file to process the data.
In the Flat File Connection Manager Editor, Enter double quotes in Text
Qualifier text box:
6. Will trigger fire when inserting data through SSIS package?
1.In the data flow task, go to the Advanced Editor of OLEDB Destination,
and there should be a property "FastLoadOptions". Specify
FIRE_TRIGGERS as an additional option.
3. Bulk Insert
Task Editor:
7. What are
the different types of Transformations you have worked
AGGEGATE -The Aggregate transformation applies aggregate functions to
column values and copies the results to the transformation output. Besides
aggregate functions, the transformation provides the GROUP BY clause,
which you can use to specify groups to aggregate across.
The Aggregate Transformation supports following operations:
Group By, Sum, Average, Count, Count Distinct, Minimum, Maximum
AUDIT - Adds Package and Task level Metadata - such as Machine Name,
Execution Instance, Package Name, Package ID, etc..
CHARACTER MAP - When it comes to string
formatting in SSIS, Character Map transformation is very useful,
used to convert data lower case, upper case.
CONDITIONAL
SPLIT – used
to split the input source data based on condition.
COPY COLUMN - Add a copy of column to the output, we can later transform the
copy keeping the original for auditing.
DATA
CONVERSION - Converts columns data types from one
to another type. It stands for Explicit Column Conversion.
DATA MINING
QUERY – Used to perform data mining query
against analysis services and manage Predictions Graphs and Controls.
DERIVED
COLUMN - Create a new (computed) column from
given expressions.
EXPORT COLUMN – Used to export a Image specific column from the database to a
flat file.
FUZZY GROUPING – Groups the rows in the
dataset that contain similar values.
FUZZY LOOKUP - Used for Pattern Matching and Ranking based on fuzzy logic.
IMPORT COLUMN - Reads image specific column
from database onto a flat file.
LOOKUP - Performs the lookup (searching) of a given reference object set
against a data source. It is used to find exact matches only.
MERGE - Merges two sorted data sets of same column structure into a
single output.
MERGE JOIN - Merges two sorted data sets into a single dataset using a join.
MULTI CAST - is used to create/distribute exact copies of the source dataset to one
or more destination datasets.
ROW COUNT - Stores the resulting row count from the data flow /
transformation into a variable.
ROW SAMPLING - Captures sample data by using
a row count of the total rows in dataflow specified by rows or percentage.
UNION ALL - Merge multiple data sets into a single dataset.
PIVOT – Used for Normalization of data
sources to reduce analomolies by converting rows into columns
UNPIVOT – Used for demoralizing the data structure by converts columns
into rows incase of building Data Warehouses.
8. What are
the different types of Transaction Options
Required: If a transaction already exists at the upper level, the current
executable will join the transaction. If No transaction at the upper level, a
new transaction is created automatically.
Supported:In any executable, if there is a transaction at upper level, the
executable join the transaction else do not create a new transaction.
Not Supported:The executable of the package do not honour any transaction ie do not
join other transaction nor creates new transaction.
9. Explain
about Checkpoints with properties
Checkpoint is used to restart the package
execution from the point of failure rather than from initial start.
Set the following Properties:
CheckpointFileName: Specifies the name of the checkpoint file.
CheckpointUsage: Never, IfExists, Always
SaveCheckpoints: indicates whether the package needs to save
checkpoints. This property must be set to True to restart a package
from a point of failure.
FailPackageOnFailure: property needs to be set to True for enabling the
task in the checkpoint.
Checkpoint mechanism uses a Text File to mark the point of package failure.
These checkpoint files are automatically
created at a given location upon the package failure and automatically deleted
once the package ends up with success.
10. How to execute SSIS Package from Stored
Procedure.
using xp_cmdshell command
11. How to enable Xp_CmdShell in Sql Server?
We can enable through either T-Sql or SQL Server Surface Area Configuration.
-- To allow advanced options to be changed.
EXEC sp_configure 'show advanced options', 1
GO-- To update the currently configured value for advanced options.RECONFIGURE
GO
-- To enable the feature.
EXEC sp_configure 'xp_cmdshell', 1
GO
-- To update the currently configured value
for this feature.
RECONFIGURE
GO
12. Package
configuration? Different types of Configuration Files
The package can be transferred across various
environments like development and unit testing, system testing, UAT and
production. Most packages will have environment specific variables like
connection string to a database or path to a flat file, or user defined
variables etc. that would be impacted while moving the package across
environments as part of deployment process. Hence, it is mandatory to change
these environment dependent variables when the package is transferred
across environments. Package configurations help in managing such changes
without actually opening and editing the SSIS package in Business Intelligence
Development Studio (BIDS). After deploying the package to a different
machine (using SQL Server or file system deployment mode) it is mandatory to
copy the related package configuration files on to that machine. If the
package is scheduled to run through a SQL Agent job, the configuration
file should be added while creating the job so that package will read the
information from the configuration file. While executing the job, SQL
Agent will take the design time values for connection strings if the package
configuration file is not supplied.
There are 5 configuration types available with
package configurations.
13. Logging. Different types of Logging files
Logging is used to log the information during the execution of package.
A log provider can be a text file, the SQL
Server Profiler, a SQL Server relational database, a Windows event log, or an
XML file. If necessary, you can define a custom log provider (e.g., a
proprietary file format).
14. How to
debug a package
For debugging a package, we have 3 options:
-Setting breakpoints in a package, container or Task
-Using Data Viewer in the Data flow task
-Setting Error redirection in the Data Flow task
15. What
is the LoggingMode property?
SSIS packages, tasks and containers have a property called LoggingMode. This
property accepts 3 possible values:
Enabled - to enable logging of that component
Disabled - to disable logging of that component
UseParentSetting - to use parent's setting of that component to
decide whether or not to log the data.
16. Error handling in SSIS package
I have created a package like below:
Select 'Load to sql Table' Data flow Task. Navigate to 'Even Handlers'
Tab.
Drag and Drop 'Execute Sql Task'. Open the Execute Sql Task Editor and in
Parameter Mapping' section, select the system variables as follows:
Create a table in Sql Server Database with
Columns as: PackageID, PackageName, TaskID, TaskName, ErrorCode,
ErrorDescription.
The package will be failed during the execution.
The error information is inserted into Table.
17. How
to configure Error Output in SSIS
We have 3 options to configure error output in ssis.
1. Ignore Failure
2. Redirect Row
3. Fail Component
For Example:
I have comma-separated value in a flat file with two columns (code,
Name). Code is an integer value and name is a varchar(20) data type configured
in the flat file connection manager. Some of the codes in the flat files
are characters. So, flat file reader component will fail reading the character
value. But, I want to redirect the error data to separate table.
18. What is Ignore Failure option in SSIS?
In Ignore
Failure option, the error will be ignored and the data row will be directed to
continue on the next transformation. Let’s say you have some JUNK data(wrong
type of data ) flowing from source, then using this option in SSIS we can
REDIRECT the junk data records to another transformation instead of FAILING the
package. This helps to MOVE only valid data to destination and JUNK can be
captured into separate file.
19.
Incremental Load in SSIS
Using Slowly Changing Dimension
Using Lookup and Cache Transformation
20. How to
migrate Sql server 2005 Package to 2008 version
1. In BIDS, by right click on the "SSIS
Packages" folder of an SSIS project and selecting "Upgrade All
Packages".
2. Running "ssisupgrade.exe" from the command line (default
physical location C:\Program Files\Microsoft SQL Server\100\DTS\Bin folder).
3. If you open a SSIS 2005 project in BIDS 2008, it will automatically launch
the SSIS package upgrade wizard.
21. Difference between Synchronous and Asynchronous Transformation
Synchronous T/F process the input rows and
passes them onto the data flow one row at a time.
When the output buffer of Transformation
created a new buffer, then it is Asynchronous transformation. Output buffer or
output rows are not sync with input buffer.
22. What are
Row Transformations, Partially Blocking Transformation, Fully Blocking
Transformation with examples.
In Row Transformation, each value
is manipulated individually. In this transformation, the buffers can be re-used
for other purposes like following:
OLEDB Datasource,
OLEDB Data Destinations
Other Row transformation within the package,
Other partially blocking transformations within the package.
examples of Row Transformations: Copy Column,
Audit, Character Map
Partially
Blocking Transformation:
These can re-use the buffer space allocated
for available Row transformation and get new buffer space allocated exclusively
for Transformation.
examples: Merge, Conditional Split,
Multicast, Lookup, Import, Export Column
Fully
Blocking Transformation:
It will make use of their own reserve buffer
and will not share buffer space from other transformation or connection
manager.
examples: Sort, Aggregate, Cache
Transformation
23. Difference between FileSystem and Sql server Deployment
File System
Deployment: We can save the package on a physical
location on hard drive or any shared folder with this option, and we should
provide a full qualified path to stored package in the FileSystem option.
Sql Server Deployment: SSIS packages will be stored in the
sysssispackages table of MSDB Database.
24. Difference between Lookup and Fuzzy Lookup transformation
Lookup Transformation finds the exact match.
Fuzzy Lookup transformation matches input table with reference table. It finds
the closest match and indicates the quality of the match.
25. Difference between Full Cache and Partial Cache
Partial Cache: The lookup cache starts off empty at the beginning of the data flow.
When a new row comes in, the lookup transform checks its cache for the matching
values. If no match is found, it queries the database. If the match is found at
the database, the values are cached so they can be used the next time a
matching row comes in.
Full Cache: The default cache mode for lookup is Full cache. The database is
queried once during the pre-execute phase of the data flow. The entire
reference set is pulled into memory. This approach uses most of the memory.
Caching takes place before any rows are read from the data flow source. Lookup
operations will be very fast during execution.
26. Cache
Transformation
Cache Transformation: to cache the data used
in the Lookup transform.
When to use Full cache mode:
When you're accessing a large portion of your reference set
When you have a small reference table
When your database is remote or under heavy load, and you want to reduce the
number of queries sent to the server
When to use Partial cache mode:
When you're processing a small number of rows and it's not worth the time to
charge the full cache.
When you have a large reference table.
When your data flow is adding new rows to your reference table.
When you want to limit the size of your reference table by modifying query with
parameters from the data flow.
27. Explain
Slowly Changing Dimesnion
The SCD concept is basically about how the data modifications are absorbed and
maintained in a Dimension Table.
The new (modified) record and the old record(s) are identified using some kind
of a flag like say IsActive, IsDeleted etc. or using Start and End Date fields
to
indicate the validity of the record.
Types:
Type 1 - update the columns in the dimension row without preserving any
change history.
Type 2 - preserve the change history in the dimension table and
create a new row when there are changes.
Type 3 - some combination of Type 1 and Type 2, usually maintaining
multiple instances of a column in the dimension row; e.g. a current value
and one or more previous values.
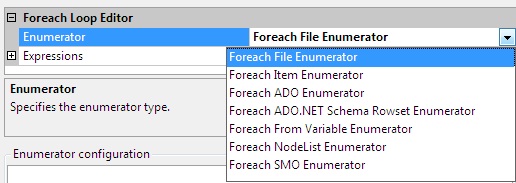
28. Different types of File Enumerators

Foreach ADO:
The ADO Enumerator enumerates rows in a table. For example, we can get the
rows in the ADO records.The variable must be of Object data type.
Foreach ADO.NET Schema Rowset:
The ADO.Net Enumerator enumerates the schema information. For example, we
can get the table from the database.
Foreach File:
The File Enumerator enumerates files in a folder. For example, we can get
all the files which have the *.txt extension in a windows folder and its sub
folders.
Foreach From Variable:
The Variable Enumerator enumerates objects that specified variables contain.
Here enumerator objects are nothing but an array or data table.
Foreach Item:
The Item Enumerator enumerates the collections. For example, we can enumerate
the names of executables and working directories that an “Execute Process” task
uses.
Foreach Nodelist:
The Node List Enumerator enumerates the result of an XPath expression.
Foreach SMO:
The SMO Enumerator enumerates SQL Server Management Objects (SMO). For example,
we can get the list of functions or views in a SQL Server database.
29. How
to execute the package from .NET?
We need a reference to Microsoft.SqlServer.ManagedDts.dll to
call a package.
using Microsoft.SqlServer.Dts.Runtime
Application app = new Application();
Package package = null;
package = app.LoadPackage(@"C:\Program Files\Microsoft SQL
Server\100\DTS\Packages\Integration Services Project2\Package.dtsx",
null);
Microsoft.SqlServer.Dts.Runtime.DTSExecResult results = package.Execute();
30. How to
schedule a package (Role of Sql Server Agent)
In order for the job to run successfully, the
SQL Server agent should be running on the target machine.
We can start the SQL Server Agent
Services in numerous ways like:-
·
Starting SQL
Server Agent Service from Command Line
·
Starting SQL
Server Agent Service from Services.MSC console
·
Starting SQL
Server Agent Service using SQL Server Configuration Manager
·
Starting SQL
Server Agent Service using SQL Server Management Studio (SSMS)
31. What are
containers? (For loop, Sequence Container)
SSIS Containers are controls that provide
structure to SSIS packages. Containers support repeating control flows in
packages and they group tasks and containers into meaningful units of work. Containers can
include other containers in addition to tasks.
|
Container Type
|
Container Description
|
Purpose of SSIS Container
|
|
Foreach Loop Container
|
This container runs a
Control Flow repeatedly using an enumerator.
|
To repeat tasks for each
element in a collection, for example retrieve files from a folder, running T-SQL
statements that reside in multiple files, or running a command for multiple
objects.
|
|
For Loop Container
|
This container runs a
Control Flow repeatedly by checking conditional expression (same
as For Loop in programming language).
|
To repeat tasks until a
specified expression evaluates to false. For example, a package can send a
different e-mail message seven times, one time for every day of the week.
|
|
Sequence Container
|
Groups tasks as well as
containers into Control Flows that are subsets of the package Control Flow.
|
This container group
tasks and containers that must succeed or fail as a unit. For example, a
package can group tasks that delete and add rows in a database table, and
then commit or roll back all the tasks when one fails.
|
32. What are precedence constraints
A task will only
execute if the condition that is set by the precedence
constraint preceding the task is met. By using these constraints,it will
choose different execution paths depending on the success or failure of other
tasks.
Success – Workflow will proceed when the
preceding container executes successfully. Indicated in control flow by a solid
green line.
Failure – Workflow will proceed when the preceding container’s
execution results in a failure. Indicated in control flow by a solid red line.
Completion – Workflow will proceed when the preceding container’s
execution completes, regardless of success or failure. Indicated in control
flow by a solid blue line.
Expression/Constraint with Logical AND – Workflow will proceed when specified expression and
constraints evaluate to true. Indicated in control flow by a solid color line
along with a small ‘fx’ icon next to it. Color of line depends on logical
constraint chosen (e.g. success=green, completion=blue).
Expression/Constraint with Logical OR – Workflow will proceed when either the specified
expression or the logical constraint (success/failure/completion) evaluates to
true. Indicated in control flow by a dotted color line along with a small ‘fx’
icon next to it. Color of line depends on logical constraint chosen (e.g.
success=green, completion=blue).
33.
Performance Optimization in SSIS
1. Avoid Asynchronous Transformation
(Sort T/F) wherever possible. Sort T/F required all the incoming rows to be
arrivaed before start processing. Instead of using Sort T/F, we get sorted rows
from datasource using ORDER By clause.
2. Pulling High Volumes of Data
Drop all Non-Clustered Indexes and Clustered
Index if exists, then Transfer and load the data into Destination Table. Create
Clustered Index and Non-clustered indexes.
3. Avoid SELECT *
DataFlow Task uses buffer oriented
architecture for data transfer and transformation. When data transfer from
Source to Destination, the data first comes into the buffer, required
transformations are done in the buffer itself and then written to Destination.
The size of buffer depends on the estimated
row size. The estimated row size is equal to the maximum size of all columns in
the row. So the more columns in a row means less number of rows in a buffer.
Hence select only those columns which are required at the destination.
Even if we need all the columns from source,
we should use the column name specifically in the SELECT statement, otherwise
it takes another round for the source to gather meta-data about the columns
when u are using SELECT *.
4. Effect of OLEDB Destination
Settings
There are couple of settings with OLEDB
destination which can impact the performance of data transfer as listed below.
Data Access
Mode – This setting provides the 'fast load'
option which internally uses a BULK INSERT statement for uploading data into
the destination table instead of a simple INSERT statement (for each single
row) as in the case for other options. So unless you have a reason for changing
it, don't change this default value of fast load. If you select the 'fast load'
option, there are also a couple of other settings which you can use as
discussed below.
Keep Identity – By default this setting is unchecked which means the destination
table (if it has an identity column) will create identity values on its own. If
you check this setting, the dataflow engine will ensure that the source
identity values are preserved and same value is inserted into the destination
table.
Keep Nulls – Again by default this setting is unchecked which means default
value will be inserted (if the default constraint is defined on the target
column) during insert into the destination table if NULL value is coming from
the source for that particular column. If you check this option then default
constraint on the destination table's column will be ignored and preserved NULL
of the source column will be inserted into the destination.
Table Lock – By default this setting is checked
and the recommendation is to let it be checked unless the same table is being
used by some other process at same time. It specifies a table lock will be
acquired on the destination table instead of acquiring multiple row level
locks, which could turn into lock escalation problems.
Check
Constraints – Again by default this setting is
checked and recommendation is to un-check it if you are sure that the incoming
data is not going to violate constraints of the destination table. This setting
specifies that the dataflow pipeline engine will validate the incoming data against
the constraints of target table. If you un-check this option it will improve
the performance of the data load.
#5 - Effect of Rows Per Batch and
Maximum Insert Commit Size Settings:
Rows per
batch:
The default value for this setting is -1
which specifies all incoming rows will be treated as a single batch. You can
change this default behavior and break all incoming rows into multiple batches.
The allowed value is only positive integer which specifies the maximum number
of rows in a batch.
Maximum insert
commit size:
The default value for this setting is
'2147483647' (largest value for 4 byte integer type) which specifies all
incoming rows will be committed once on successful completion. You can specify
a positive value for this setting to indicate that commit will be done for
those number of records. Changing the default value for this setting will put
overhead on the dataflow engine to commit several times. Yes that is true, but
at the same time it will release the pressure on the transaction log and tempdb
to grow specifically during high volume data transfers.
The above two settings are very important to
understand to improve the performance of tempdb and the transaction log. For
example if you leave 'Max insert commit size' to its default, the transaction
log and tempdb will keep on growing during the extraction process and if you
are transferring a high volume of data the tempdb will soon run out of memory
as a result of this your extraction will fail. So it is recommended to set
these values to an optimum value based on your environment.
#7 - DefaultBufferSize and
DefaultBufferMaxRows :
The execution tree creates buffers for
storing incoming rows and performing transformations.
The number of buffer created is dependent on
how many rows fit into a buffer and how many rows fit into a buffer dependent
on few other factors. The first consideration is the estimated row size, which
is the sum of the maximum sizes of all the columns from the incoming records.
The second consideration is the DefaultBufferMaxSize property of the data flow
task. This property specifies the default maximum size of a buffer. The default
value is 10 MB and its upper and lower boundaries are constrained by two
internal properties of SSIS which are MaxBufferSize (100MB) and MinBufferSize
(64 KB). It means the size of a buffer can be as small as 64 KB and as large as
100 MB. The third factor is, DefaultBufferMaxRows which is again a property of
data flow task which specifies the default number of rows in a buffer. Its
default value is 10000.
If the size exceeds the DefaultBufferMaxSize
then it reduces the rows in the buffer. For better buffer performance you can
do two things.
First you can remove unwanted columns from
the source and set data type in each column appropriately, especially if your
source is flat file. This will enable you to accommodate as many rows as
possible in the buffer.
Second, if your system has sufficient memory
available, you can tune these properties to have a small number of large
buffers, which could improve performance. Beware if you change the values of
these properties to a point where page spooling (see Best Practices #8) begins,
it adversely impacts performance. So before you set a value for these
properties, first thoroughly testing in your environment and set the values
appropriately.
#8 - How DelayValidation property can
help you
SSIS uses two types of validation.
First is package validation (early validation)
which validates the package and all its components before starting the
execution of the package.
Second SSIS uses component validation (late
validation), which validates the components of the package once started.
Let's consider a scenario where the first
component of the package creates an object i.e. a temporary table, which is
being referenced by the second component of the package. During package
validation, the first component has not yet executed, so no object has been
created causing a package validation failure when validating the second
component. SSIS will throw a validation exception and will not start the
package execution. So how will you get this package running in this common
scenario?
To help you in this scenario, every component has a DelayValidation
(default=FALSE) property. If you set it to TRUE, early validation will be
skipped and the component will be validated only at the component level (late
validation) which is during package execution
9. Better performance with parallel execution
10. When to use events logging and when to avoid.
11. Monitoring the SSIS Performance with Performance Counters
Launch Performance Monitor:
1. Start -> All Programs -> Administrative Tools -> Performance
2. Load the SSIS related Counters
In the Performance Object, select SQL Server:SSIS Pipeline and SQL Server:SSIS
Service.
SSIS provide a set of performance counters. Among them, the following few are
helpful when you tune or debug your package:
Buffers in use
Flat buffers in use
Private buffers in use
Buffers spooled
Rows read
Rows written
“Buffers in use”, “Flat buffers in use” and “Private buffers in use” are useful
to discover leaks. During package execution time, we will see these counters
fluctuating. But once the package finishes execution, their values should
return to the same value as what they were before the execution. Otherwise,
buffers are leaked.
“Buffers spooled” has an initial value of 0. When it goes above 0, it indicates
that the engine has started memory swapping. In a case like this, set Data Flow
Task properties BLOBTempStoragePath and BufferTempStoragePath appropriately for
maximal I/O bandwidth.
Buffers Spooled: The number of buffers currently written to the disk. If
the data flow engine runs low on physical memory, buffers not currently used
are written to disk and then reloaded when needed.
“Rows read” and “Rows written” show how many rows the entire Data Flow has
processed.
12. FastParse property
Fast Parse option in SSIS can be used for very fast loading of flat file data.
It will speed up parsing of integer, date and time types if the conversion does
not have to be locale-sensitive. This option is set on a per-column basis using
the Advanced Editor for the flat file source.

13. Checkpoint features helps in package restarting
34. Upgrade
DTS package to SSIS
1. In BIDS, from the Project Menu, select 'Migrate
DTS 2000 Package'
2. In the Package Migration Wizard, choose
the Source, Sql Server 2000 Server Name, Destination folder.
3. Select the List of packages that needs to
be upgraded to SSIS
4. Specifty the Log file for Package
Migration.
35. Events in
SSIS
OnError : Runs when a task or container
reports an error.
OnExecStatusChanged : Runs for all tasks and
containers when the execution status changes to In Process, Success, or Failed.
OnInformation : Runs when SSIS outputs
information messages during the validation and execution of a task or
container.
OnPostExecute : Runs after a container or
task successfully completes.
OnPostValidate : Executes after a container
or task has successfully been validated.
OnPreExecute : Runs just before a container
or task is executed.
OnPreValidate: Runs before the component is
validated by the engine.
OnProgress : Executed when a progress message
is sent by the SSIS engine, indicating tangible advancement of the task or
container.
OnQueryCancel : Invoked when an Execute SQL
Task is cancelled through manual intervention, such as stopping the package.
OnTaskFailed : Similar to OnError, but runs
when a task fails rather than each time an error occurs.
OnVariableValueChanged: Runs when the value
changes in a variable for which the RaiseChangeEvent property is set to True.
OnWarning Runs: when a task returns a warning
event such as a column not being used in a data flow.
36. Difference between Control Flow and Data Flow
1.Control flow consists of one or more tasks
and containers that execute when the package runs. We use precedence
constraints to connect the tasks and containers in a package. SSIS provides three
different types of control flow elements: Containers that provide structures in
packages, Tasks that provide functionality, and Precedence Constraints that
connect the executables, containers, and tasks into an ordered control flow.
2.Control flow does not move data from task to task.
3.Tasks are run in series if connected with precedence or in parallel.
1. A data flow consists of the sources and
destinations that extract and load data, the transformations that modify and
extend data, and the paths that link sources, transformations, and
destinations. The Data Flow task is the executable within the SSIS package that
creates, orders, and runs the data flow. Data Sources, Transformations, and
Data Destinations are the three important categories in the Data Flow.
2. Data flows move data, but there are also tasks in the control flow,
as such, their success or Failure effects how your control flow operates
3. Data is moved and manipulated through transformations.
4. Data is passed between each component in the data flow.
37. Different ways to execute SSIS package
1. Using the Execute Package Utility (DTEXECUI.EXE) graphical interface one can execute an SSIS
package that is stored in a File System, SQL Server or an SSIS Package Store.
DTEXECUI provides a graphical user interface that can be used to
specify the various options to be set when executing an SSIS package. You
can launch DTEXECUI by double-clicking on an SSIS package file (.dtsx).
You can also launch DTEXECUI from a Command Prompt then specify the
package to execute.
2. Using the
DTEXEC.EXE command line utility one can execute an SSIS package that is stored in a File System, SQL
Server or an SSIS Package Store. The syntax to execute a SSIS package which is
stored in a File System is shown below.
DTEXEC.EXE /F
"C:\BulkInsert\BulkInsertTask.dtsx"
3. Test the SSIS
package execution by running the package from BIDS:
-In Solution Explorer,
right click the SSIS project folder that contains the package which you want to
run and then click properties.
- In the SSIS Property
Pages dialog box, select Build option under the Configuration Properties node
and in the right side panel, provide the folder location where you want the
SSIS package to be deployed within the OutputPath. Click OK to save the changes
in the property page.
-Right click the package
within Solution Explorer and select Execute Package option from the drop down
menu
4. Sql Server Agent:
Drill down to the SQL Server Agent node in the Object Explorer. Right
click on the Jobs node and select New Job from the popup menu.
The first step to setting up the proxy is to create a credential (alternatively
you could use an existing credential). Navigate to Security then
Credentials in SSMS Object Explorer and right click to create a new credential
Navigate to SQL Server Agent then Proxies in SSMS Object Explorer and right
click to create a new proxy
38. How to execute a Stored Procedure from SSIS
using Execute SQL Task
39. How to
deploy packages from one server to another server
1.To copy the
deployment bundle
Locate the deployment bundle on the first server.
If you used the default location, the deployment bundle is the Bin\Deployment
folder.
Right-click the Deployment folder and click Copy.
Locate the public share to which you want to copy the folder on the target
computer and click Paste.
2: Running the Package Installation Wizard
1. On the destination computer, locate the deployment bundle.
2. In the Deployment folder, double-click the manifest file,
Project1.SSISDeploymentManifest.
3. On the Welcome page of the Package Installation Wizard, click Next.
4. On the Deploy SSIS Packages page, select either File sytem or SQL Server
deployment option, select the "Validate packages after installation"
check box, and then click Next.
5. On the Specify Target SQL Server page, specify (local), in the Server name
box.
6. If the instance of SQL Server supports Windows Authentication, select Use
Windows Authentication; otherwise, select Use SQL Server Authentication
and provide a user name and a password.
7. Verify that the "Rely on server storage for encryption" check box
is cleared.
Click Next.
8. On the Select Installation Folder page, click Browse.
9. On the Confirm Installation page, click Next.
10. The wizard installs the packages. After installation is completed, the
Configure Packages page opens.

40. How to
deploy a package
Right click on the Solution in Solution Explorer
and choose properties in the Menu.


When the build /rebuild is successful,
navigate to the directory is referred in DeploymentOutputPath
Deploying the Package:
Double click the Manifest File to start the
deployment. The Package Installation wizard begins and Deploy SSIS Packages
step is the first screen that is presented.

This screen lets you select where shall the
packages be deployed, as mentioned in the Dialog Box, deploying in SQL Server
is more secure, since SQL Server stores the packages internally compared to
File System where additional security measures needs to taken to secure the physical
files.


41. What is
the use of Percentage Sampling transformation in SSIS?
Percentage
Sampling transformation is generally used for data mining. This transformation
builds a random sample of set of output rows by choosing specified percentage
of input rows. For example if the input has 1000 rows and if I specify 10
as percentage sample then the transformation returns 10% of the RANDOM
records from the input data.
42.
What is the use of Term Extraction transformation in SSIS?
Term Extraction
transformation is used to extract nouns or noun phrases or both noun and noun
phrases only from English text. It extracts terms from text in a
transformation input column and then writes the terms to a transformation
output column. It can be also used to find out the content of a dataset.
43.
What is Data Viewer and what are the different types of Data Viewers in SSIS?
A Data Viewer
allows viewing data at a point of time at runtime.
The different
types of data viewers are:
1. Grid
2. Histogram
3. Scatter
Plot
4. Column
Chart
44.
Difference between Merge and UnionAll Transformations
The Union All transformation combines multiple inputs into one output. The
transformation inputs are added to the transformation output one after the other;
no reordering of rows occurs.
Merge Transformations combines two sorted data sets of same column
structure into a single output.The rows from each dataset are inserted into the
output based on values in their key columns.
The Merge transformation is similar to the Union All transformations. Use the
Union All transformation instead of the Merge transformation in the following
situations:
-The Source Input rows are not need to be
sorted.
-The combined output does not need to be
sorted.
-when we have more than 2 source inputs.
45.
Multicast, Conditional Split, Bulk Insert Tasks
Multicast
Transformation is used to extract output from single
source and places onto multiple destinations.
Conditional Split transformation is used for splitting the input
data based on a specific condition. The condition is evaluated in VB Script.
Multicast Transformation generates exact copies
of the source data, it means each recipient will have same number of records as
the source whereas the Conditional Split Transformation divides the source data
based on the defined conditions and if no rows match with this defined
conditions those rows are put on default output.
Bulk Insert Task is used to copy the large volumn of data from text
file to sql server destination.
46.
Explain Audit Transformation ?
It allows you
to add auditing information. Auditing options that you can add to transformed
data through this transformation are :
1. Execution of Instance GUID : ID of execution instance of the package
2. PackageID : ID of the package
3. PackageName : Name of the Package
4. VersionID : GUID version of the package
5. Execution StartTime
6. MachineName
7. UserName
8. TaskName
9. TaskID : unique identifier type of the data flow task that contains audit
transformation.
47.
what are the possible locations to save SSIS package?
1.File
System: We can save the package on a physical location on hard drive
or any shared folder with this option, and we should provide a full qualified
path to stored package in the FileSystem option.
2. Sql Server: SSIS
packages will be stored in the MSDB database, in the sysssispackages
table.
SSIS Package
Store is nothing but combination of SQL Server and File System deployment, as
you can see when you connect to SSIS through SSMS: it looks like a store which
has categorized its contents (packages) into different categories based on its
manager’s (which is you, as the package developer) taste. So, don’t get it
wrong as something different from the 2 types of package deployment.
48. How
to provide security to packages?
We can
provide security to packages in 2 ways
1. Package encryption
2. Password protection

1. DonotSaveSensitive: any sensitive information is simply not
written out to the package XML file when you save the package.
2. EncryptSensitiveWithUserKey: encrypts sensitive information
based on the credentials of the user who created the package. It is the
default value for the ProtectionLevel property.
3. EncryptSensitiveWithPassword: requires to specify a password in
the package, and this password will be used to encrypt and decrypt the
sensitive information in the package.
4. EncryptAllWithPassword: allows to encrypt the entire
contents of the SSIS package with your specified password.
5. EncryptAllWithUserKey: allows to encrypt the entire contents of
the SSIS package by using the user key.
6. Server Storage: allows the package to retain all sensitive
information when you are saving the package to SQL Server. SSIS packages
are saved to MSDB database of SQL Server.
You can change the Protection Level of deployed packages by using the DTUTIL
utility.
49. How to track a variable in ssis?
OnVariableValueChanged:
This event gets raised when value of the variable is changed.
1.Set the "EvaluateasExpression" property of the variable as True.
2.Set the "RaiseChangedEvent" property of the
variable as True.
3.Create an event handler for the "OnVariableValueChanged"
event for the container in which the variable is scoped.
50. FTP Task:
The FTP task downloads and uploads data files
and manages directories on servers. For example, a package can download data
files from a remote server.
use the FTP task for the following purposes:
1. Copying directories and data files from one directory to another, before or
after moving data, and applying transformations to the data.
2. Downloading files from an FTP location and applying transformations to
column data before loading the data into a database.
At run time, the FTP task connects to a server by using an FTP connection
manager. The FTP connection manager includes the server settings, the
credentials for accessing the FTP server, and options such as the time-out and
the number of retries for connecting to the server.
The FTP connection manager supports only anonymous authentication and basic
authentication. It does not support Windows Authentication.
Predefined FTP Operations:
Send Files,
Receive File,
Create Local directory, Remove Local Directory,
Create Remote Directory, Remove Remote Directory
Delete Local Files, Delete Remote File
Customer Log Entries available on FTP Task:
FTPConnectingToServer
FTPOperation
51. New features in SSIS 2012
1. GUI Improvements - -Sort packages by
name -Package visualization -Zoom -Data flow source/destination
wizard -Grouping in data flow
2. CDC (Change Data Capture) Task and
Components - -CDC is
nothing but Incremental load loads all rows that have changed since the last
load -CDC needs to keep track of which changes have already been
processed. -CDC task does this by storing LSNs in a tracking
table -CDC source component reads from the CDC table function, based on
the LSN it for from the CDC task. -CDC transformation splits records into
new rows, updated rows and deleted rows.
3. Flat File Connection Manager Changes - -The Flat File connection manager now supports
parsing files with embedded qualifiers. The connection manager also by default
always checks for row delimiters to enable the correct parsing of files with
rows that are missing column fields. The Flat File Source now supports a
varying number of columns, and embedded qualifiers.
4. Offline Connection Managers: Integration Services now validates all
connections before validating all of the data flow components when a package is
opened and sets any connections that are slow or unavailable to work offline.
This helps to reduce the delay in validating the package data flow. After a
package is opened, you can also turn off a connection by right-clicking the connection
manager in the Connection Managers area and then clicking Work Offline. This
can speed up operations in the SSIS Designer.
5. New Functions/Expressions in SSIS 2012:
LEFT: You now can easily return the
leftmost portion of a string rather than use the SUBSTRING function. Left
syntax is the same as we know in
T-SQL: LEFT(character_expression,number)
REPLACENULL: You can use this function
to replace NULL values in the first argument with the expression specified in
the second argument. This is equivalent to ISNULL in
T-SQL: REPLACENULL(expression, expression)
TOKEN: This function allows you to
return a substring by using delimiters to separate a string into tokens and
then specifying which occurrence to return: TOKEN(character_expression,
delimiter_string, occurrence)
TOKENCOUNT: This
function uses delimiters to separate a string into tokens and then returns the
count of tokens found within the string: TOKENCOUNT(character_expression,
delimiter_string)
6. Easy Column Remapping in Data Flow (Mapping
Data Flow Columns) -When modifying a data flow, column remapping is
sometimes needed -SSIS 2012 maps columns on name instead of id -It
also has an improved remapping dialog
7. Shared Connection Managers: To create connection managers at the project level
that can shared by multiple packages in the project. The connection manager you
create at the project level is automatically visible in the Connection Managers
tab of the SSIS Designer window for all packages. -When converting shared
connection managers back to regular (package) connection managers, they
disappear in all other packages.
8. Scripting Enhancements: Now Script task and Script Component support
for 4.0. - Breakpoints are supported in Script Component
9. ODBC Source and Destination - -ODBC was
not natively supported in 2008 -SSIS 2012 has ODBC source &
destination -SSIS 2008 could access ODBC via ADO.NET
10. Reduced Memory Usage by the Merge and Merge
Join Transformations – The old SSIS Merge and Merge Join transformations,
although helpful, used a lot of system resources and could be a memory hog. In
2012 these tasks are much more robust and reliable. Most importantly, they will
not consume excessive memory when the multiple inputs produce data at uneven
rates.
11. Undo/Redo: One thing that annoys users in SSIS before 2012 is
lack of support of Undo and Redo. Once you performed an operation, you can’t
undo that. Now in SSIS 2012, we can see the support of undo/redo.
52. Difference between Script Task and Script Component in SSIS.
|
Script Task
|
Script Component
|
|
Control
Flow/Date Flow
|
The Script task is configured on the
Control Flow tab of the designer and runs outside the data flow of the
package.
|
The Script component is configured on the
Data Flow page of the designer and represents a source, transformation, or
destination in the Data Flow task.
|
|
Purpose
|
A Script task can accomplish almost any
general-purpose task.
|
You must specify whether you want to create
a source, transformation, or destination with the Script component.
|
|
Raising
Results
|
The Script task uses both the TaskResult
property and the optional ExecutionValue property of the Dts object to notify
the runtime of its results.
|
The Script component runs as a part of the
Data Flow task and does not report results using either of these properties.
|
|
Raising
Events
|
The Script task uses the Events property of
the Dts object to raise events. For example: Dts.Events.FireError(0,
"Event Snippet", ex.Message & ControlChars.CrLf &
ex.StackTrace
|
The Script component raises errors,
warnings, and informational messages by using the methods of the
IDTSComponentMetaData100 interface returned by the ComponentMetaData
property. For example:
Dim myMetadata as IDTSComponentMetaData100
myMetaData = Me.ComponentMetaData
myMetaData.FireError(...)
|
|
Execution
|
A Script task runs custom code at some
point in the package workflow. Unless you put it in a loop container or an
event handler, it only runs once.
|
A Script component also runs once, but
typically it runs its main processing routine once for each row of data in
the data flow.
|
|
Editor
|
The Script Task Editor has three pages:
General, Script, and Expressions. Only the ReadOnlyVariables and
ReadWriteVariables, and ScriptLanguage properties directly affect the code that
you can write.
|
The Script Transformation Editor has up to
four pages: Input Columns, Inputs and Outputs, Script, and Connection
Managers. The metadata and properties that you configure on each of these
pages determines the members of the base classes that are autogenerated for
your use in coding.
|
|
Interaction
with the Package
|
In the code written for a Script task, you
use the Dts property to access other features of the package. The Dts
property is a member of the ScriptMain class.
|
In Script component code, you use typed
accessor properties to access certain package features such as variables and
connection managers. The PreExecute method can access only read-only
variables. The PostExecute method can access both read-only and read/write
variables.
|
|
Using
Variables
|
The Script task uses the Variables property
of the Dts object to access variables that are available through the task’s
ReadOnlyVariables and ReadWriteVariables properties. For example: string
myVar;
myVar = Dts.Variables["MyStringVariable"].Value.ToString();
|
The Script component uses typed accessor
properties of the autogenerated based class, created from the component’s
ReadOnlyVariables and ReadWriteVariables properties. For example:
string myVar; myVar =
this.Variables.MyStringVariable;
|
|
Using
Connections
|
The Script task uses the Connections
property of the Dts object to access connection managers defined in the
package. For example:
string myFlatFileConnection;
myFlatFileConnection = (Dts.Connections["Test Flat File
Connection"].AcquireConnection(Dts.Transaction) as String);
|
The Script component uses typed accessor
properties of the autogenerated base class, created from the list of
connection managers entered by the user on the Connection Managers page of
the editor. For example: IDTSConnectionManager100
connMgr;connMgr = this.Connections.MyADONETConnection;
|
53.Difference between DTS and SSIS?
DTS:
Limited number of transformations.
Limited error handling.
Message box in active-x scripts.
SSIS:
More number of transformations.
Better error handling.
Message box in .NET scripting.
54. How to execute package from
command line
1. To execute an SSIS package saved to SQL
Server using Windows Authentication:
dtexec /sq pkgOne /ser productionServer
2. To execute an SSIS package that is saved in the file system:
dtexec /f "c:\pkgOne.dtsx"
3. To execute an SSIS package saved to the File System folder in the SSIS
Package Store:
dtexec /dts "\File
System\MyPackage"
4. To execute an SSIS package that is saved in the file system and configured
externally:
dtexec /f "c:\pkgOne.dtsx" /conf
"c:\pkgOneConfig.cfg"
55. How to unzip a File in SSIS?
Use Execute Process Task in
the Control Flow.
From BIDS, drag and drop an "Execute
Process Task" to the control flow and configure.
In the Execute Process, perform the following
configurations:
Executable: The path of the application that
is being used.
Arguments: Need to supply the arguments to extract the zipped
files.
Working Directory: The current directory for all process.
56. which service requires to start a job
SQL Server Agent Service
57. Difference between OLEDB Destination, SQL Destination, Bulk Insert
1. OLEDB destination loads the records in batches, where as SQL Server
destination loads all the records at one go.
2. OLEDB Destination uses the 'Fast Load' data access mode.
SQL Server destination uses shared memory for maximum loading speed, must
execute on the same server as the database engine.
Prefer the OLE-DB Destination simply because it gives better flexibility on
where you execute the package.
3. The Bulk Insert task uses the T-SQL BULK INSERT statement for speed when
loading large amounts of data.
58.which services are installed during Sql Server installation
SSIS
SSAS
SSRS
SQL Server (MSSQLSERVER)
SQL Server Agent Service
SQL Server Browser
SQL Full-Text
59. How to
run dynamic T-SQL in SSIS?
Option#1: Using Script Component as
Destination
Option#2: Using Object Variable and run t-sql
with Execute SQL Task
60. What is
the use of RecordSet Destination?
The Recordset destination does not save data
to an external data source. Instead, it saves data in memory in a recordset
that is stored in variable of the Object data type. After the Recordset
destination saves the data, we use a Foreach Loop container with the Foreach
ADO enumerator to process one row of the recordset at a time. The Foreach
ADO enumerator saves the value from each column of the current row into a
separate package variable. Then, the tasks that you configure inside the
Foreach Loop container read those values from the variables and perform some
action with them.
61. Delay Validation, Forced Execution
Delay Validation: Validation take place during the package execution.
Early Validation: Validation take place just
before the package execution.
62. Transfer Database Task
used to move a database to another SQL Server instance or create a copy on the
same instance (with different database name). This task works in two modes:
Offline, Online.

Offline: In this mode, the source database is detached from the source
server after putting it in single user mode, copies of the mdf, ndf and ldf
files are moved to specified network location. On the destination server the
copies are taken from the network location to the destination server and then
finally both databases are attached on the source and destination servers. This
mode is faster, but a disadvantage with mode is that the source database will
not available during copy and move operation. Also, the person executing the
package with this mode must be sysadmin on both source and destination
instances.
Online: The task uses SMO to transfer the database objects to the
destination server. In this mode, the database is online during the copy and
move operation, but it will take longer as it has to copy each object from the
database individually. Someone executing the package with this mode must
be either sysadmin or database owner of the specified databases.
63. Transfer SQL Server Object Task
Used to transfer one or more SQL Server
objects to a different database, either on the same or another SQL Server
instance. You can transfer tables, views, Indexes, stored procedures, User
defined functions, Users, Roles etc.
64. How to
Generate an Auto Incremental Number in a SSIS Package?
A script component can
be used for the designated task. The steps are as follows:
1. Drag and drop the Script Document to the
Data flow and select the Script Component Type as Transformation.
2. Double click the Script Component.
3. Select the column which is to pass through
the script component, in the Input Columns tab.
4. Add a column with an integer data type, in
the Inputs and Outputs tab.
65. Breakpoint in SSIS?
A breakpoint allows you to pause the
execution of the package in BIDS during development or when troubleshooting an
SSIS Package. You can right click on the task in control flow, click on 'Edit
Breakpoint' menu and from the Set Breakpoint window, you specify when you want
execution to be halted/paused. For example OnPreExecute, OnPostExecute, OnError
events, etc. To toggle a breakpoint, delete all breakpoints and disable all
breakpoints go to the Debug menu and click on the respective menu item. You can
even specify different conditions to hit the breakpoint as well.
66. What is the DisableEventHandlers property used for?
SSIS packages, tasks and containers have a property called
DisableEventHandlers. If you set this property to TRUE for task or
container, then all event handlers will be disabled for that task or container.
If you set this property value to FALSE then the event handlers will once
again be executed.
67. How to create Temporary Table using SSIS?
1. For the connection manager, set the property RetainSameConnection =True
so that temporary table created in one Control Flow task can be retained in
another task.
RetainSameConnection means that the temp table will not be deleted when the
task is completed.
2. Create a data-flow task that consumes your global temp table in an OLE
DB Source component.
3. Set DelayValidation=TRUE on the data-flow task,
means that the task will not check if the table exists upon creation.
68. How to Lock a variable in Script Task?
public void Main()
{
Variables vars = null ;
bool fireAgain = true;
Dts.VariableDispenser.LockOneForRead("varName", ref
vars);
//Do something with the value...
vars.Unlock();
Dts.TaskResult = (int)ScriptResults.Success;
}
69. How to
pass property value at Run time?
A property value like connection string for a
Connection Manager can be passed to the package using package
configurations.
70. How to
skip first 5 lines in each Input flat file?
In the Flat file connection manager editor, Set the 'Header rows to skip'
property.
71. Parallel
processing in SSIS
To support parallel execution of different tasks in the package, SSIS uses 2
properties:
1.MaxConcurrentExecutables: defines how many tasks can run simultaneously, by specifying the
maximum number of SSIS threads that can execute in parallel per package. The
default is -1, which equates to number of physical or logical processor + 2.
2.
EngineThreads: is property of each DataFlow task. This
property defines how many threads the data flow engine can create and run in
parallel. The EngineThreads property applies equally to both the source threads
that the data flow engine creates for sources and the worker threads that the
engine creates for transformations and destinations. Therefore, setting
EngineThreads to 10 means that the engine can create up to ten source threads
and up to ten worker threads.
72. How
do we convert data type in SSIS?
The Data Conversion Transformation in SSIS
converts the data type of an input column to a different data type.
SSRS Interview Questions and Answers
1. How do u implement Cascading parameter?
The list of values for one parameter depends
on the value chosen in preceding parameter.
Eg: Country --> State --> City
2. How to
pass parameter from Report Viewer Control to sub report?
3. How to
open another report in a new window from existing report?
Use a little javascript with a customized URL
in the "Jump to URL" option of the Navigation tab.
Non-parameterized
Solution
To get started, let's pop up a simple non
parameterized report. Follow these instructions:
1.
Instead of
using the "Jump to Report" option on the Navigation tab, use the
"Jump to URL" option.
2.
Open the
expression screen (Fx button).
3.
Enter the
following:
="javascript:void(window.open('http://servername?%2freportserver%2fpathto%2freport&rs:Command=Render'))"
4.
Click OK
twice, then save and deploy the report.
Parameterized
Solution
Assume you have a field called ProductCode.
Normally, you might hard code that like this:
http://servername/reportserver?%2fpathto%2freport&rs:Command=Render&ProductCode=123
In this case, you want to pass variables
dynamically, using an available value from the source dataset. You can
think of it like this:
http://servername/reportserver?%2fpathto%2freport&rs:Command=Render&ProductCode=Fields!ProductCode.Value
The exact syntax in the "Jump to
URL" (Fx) expression window will be:
="javascript:void(window.open('http://servername/reportserver?%2fpathto%2freport&rs:Command=Render&ProductCode="+Fields!ProductCode.Value+"'))"
4. How to
pass parameter from chart to Table in same report?
5. How to
apply custom Colors of chart report?
STEP1:
Create your custome color palette in the
report using Custom Code in your report. To do so, click Report => Report
Properties => Code and copy below code:
Private colorPalette As String() = {
"Blue", "Red", "Teal", "Gold",
"Green","#A59D93", "#B8341B",
"#352F26", "#F1E7D6", "#E16C56",
"#CFBA9B"}
Private count As Integer = 0
Private mapping As New
System.Collections.Hashtable()
Public Function GetColor(ByVal groupingValue
As String) As String
If mapping.ContainsKey(groupingValue) Then
Return mapping(groupingValue)
End If
Dim c As String = colorPalette(count Mod
colorPalette.Length)
count = count + 1
mapping.Add(groupingValue, c)
Return c
End Function
STEP2:
In the Pie Chart, select Series Properties
and select the Fill option from left side.
Now write following expression in the Color
expression:
=code.GetColor(Fields!Year.Value)
Here Fields!Year.Value is a field of dataset
which is used as Chart Category fields.
6. Can
we have Table within a Table in SSRS report?
Yes. We can have Nested Tables.
7. How to
apply stylesheet to SSRS Reports
select Report->Report Properties
from the menu and then click the Code tab.
Function StyleElement (ByVal Element As String) As String
Select Case
UCase(Element)
Case "TABLE_HEADER_BG"
Return "Red"
Case "TABLE_FOOTER_BG"
Return "Green"
Case "TABLE_HEADER_TEXT"
Return "White"t;
Case e Elsese
Return "Black”k”
End Select
End Function
Now apply this function to the style property
of an element on the report.
=code.StyleElement("TABLE_HEADER_TEXT")
If you want apply dynamic styles to report,
then create tables in sql server and insert style information into the tables.
Create a Dataset, specify the Stored
Procedure.
example: =Fields!TABLE_HEADER_TEXT.Value
where TABLE_HEADER_TEXT is a value in the
table.
8. Dynamic
sorting, Dynamic Grouping in SSRS
Can be done using expressions.
9. Different types
of Filters
The 2 types of filters in SSRS are:
Dataset Filter:
Filtering within the source query. When you implement a filter within the
data set, less data is sent from the source database server to the Report
Server - usually a good thing.
Report Filter: This
includes filtering after the source query has come back – on a data region
(like the Tablix), or a data grouping. When you implement a filter within
the report, when the report is re-executed again with different parameter
choices, the Report Server uses cached data rather than returning to the
database server.
Using a Dataset Filter is the most efficient method.
10.
Difference between Filter and Parameter? Which one is better?
In case of Filters, first the data will be
fetched from the database, then the Filters are applied on the fetched data.
Filters are applied at run time first on the dataset, and then on the data
region, and then on the group, in top-down order for group hierarchies.
To add a filter, we must specify a filter equation
(expression). The data type of filtered data and value must match.
Parameters are applied at the database level.
The Data will be fetched based on parameters at the database level using WHERE
condition in the query.
Parameters are better than Filters in
performance.
11.
Optimization of Report
Report can be optimized in terms of Grouping, Filters.
Report can be optimized through Caching,
Snapshot and subscriptions.
1. The total time to generate a report (RDL) can be divided into 3 elements:
Time to retrieve the data (TimeDataRetrieval).
Time to process the report (TimeProcessing)
Time to render the report (TimeRendering)
Total time = (TimeDataRetrieval) + (TimeProcessing) + (TimeRendering)
These 3 performance components are logged every time for which a deployed
report is executed. This information can be found in the table
ExecutionLogStorage in the ReportServer database.
SELECT TOP 10 Itempath, parameters,
TimeDataRetrieval + TimeProcessing + TimeRendering as
[total time],
TimeDataRetrieval, TimeProcessing, TimeRendering,
ByteCount, [RowCount],Source, AdditionalInfo
FROM ExecutionLogStorage
ORDER BY Timestart DESC
2. Use the SQL Profiler to see which queries are executed when the report is
generated. Sometimes you will see more queries being executed than you
expected. Every dataset in the report will be executed. A lot of times new
datasets are added during building of reports. Check if all datasets are still
being used. For instance, datasets for available parameter values. Remove all
datasets which are not used anymore.
3. Sometimes a dataset contains more columns than used in the Tablix\list. Use
only required columns in the Dataset.
4. ORDER BY in the dataset differs from the ORDER BY in the Tablix\list. You
need to decide where the data will be sorted. It can be done within SQL Server
with an ORDER BY clause or in by the Reporting server engine. It is not useful
to do it in both. If an index is available use the ORDER BY in your dataset.
5. Use the SQL Profiler to measure the performance of all datasets (Reads, CPU
and Duration). Use the SQL Server Management Studio (SSMS) to analyze the
execution plan of every dataset.
6. Avoid dataset with result sets with a lot of records like more than 1000
records. A lot of times data is GROUPED in the report without an Drill
down option. In that scenario do the group by already in your dataset. This
will save a lot of data transfer to the SQL Server and it will save the
reporting server engine to group the result set.
7. Rendering of the report can take a while if the result set is very big. Look
very critical if such a big result set is necessary. If details are used in
only 5 % of the situations, create another report to display the details. This
will avoid the retrieval of all details in 95 % of the situations.
12. I have
'State' column in report, display the States in bold, whose State name starts
with letter 'A' (eg: Andhra pradesh, Assam should be in bold)
13. In which
scenario you used Matrix Report
Use a matrix to display aggregated data
summaries, grouped in rows and columns, similar to a PivotTable or crosstab.
The number of rows and columns for groups is determined by the number of unique
values for each row and column groups.
14. Image
control in SSRS
An image is a report item that contains a
reference to an image that is stored on the report server, embedded within the
report, or stored in a database.
Image Source : Embedded
Local report images are embedded in the report and then referenced. When you
embed an image, Report Designer MIME-encodes the image and stores it as text in
the report definition.
When to Use:
When image is embedded locally within the report.
When you are required to store all images within the report definition.

Image Source : External
When you use an external image in a report, the image source is set to External
and the value for the image is the URL to the image.
When to Use:
When images are stored in a File System, External File Share or Web Site.
Image Source : Database
If we add images that are stored in a database to report then such image is
known as a data-bound image. Data-bound images can also be displayed from
binary data (BLOB) stored in a database.
When to use:
When image is stored in a Database.
When you specify a dataset field that is bound to a database field that
contains an image.
15. Role of
Report Manager
Deploying the reports onto the web server.
Delivering the reports through E-mail or File
Share using the subscriptions.
Creating the Cached and Snapshot Reports.
Providing the Security to the reports.
16. How to
upload a report to report server
In the Report Manager, we have upload option
to upload the reports.
17. What is a
Shared Dataset
Shared datasets retrieve data from shared
data sources that connect to external data sources. A shared dataset contains a
query to provide a consistent set of data for multiple reports. The dataset
query can include dataset parameters.
Shared datasets use only shared data sources,
not embedded data sources.
To create a shared dataset, you must use an
application that creates a shared dataset definition file (.rsd). You can use
one of the following applications to create a shared dataset:
1. Report Builder: Use shared dataset design
mode and save the shared dataset to a report server or SharePoint site.
2. Report Designer in BIDS: Create shared
datasets under the Shared Dataset folder in Solution Explorer. To publish a
shared dataset, deploy it to a report server or SharePoint site.
Upload a shared dataset definition (.rsd)
file. You can upload a file to the report server or SharePoint site. On a
SharePoint site, an uploaded file is not validated against the schema until the
shared dataset is cached or used in a report.
The shared dataset definition includes a
query, dataset parameters including default values, data options such as case
sensitivity, and dataset filters.
18. How do u
display the partial text in bold format in textbox in Report? (eg: FirstName
LastName, where "FirstName" should in bold fornt and
"LastName" should be in normal font.)
Use PlaceHolder
19. How
to Keep Headers Visible When Scrolling Through a Report?
1. Right-click the row, column, or corner handle of a tablix data region, and
then click Tablix Properties.
2. On the General tab, under Row Headers or Column Headers, select Header
should remain visible while scrolling.
3. Click OK.
To keep a static tablix member (row or column) visible while scrolling
1. On the design surface, click the row or column handle of the tablix data
region to select it. The Grouping pane displays the row and column groups.
2. On the right side of the Grouping pane, click the down arrow, and then clickAdvanced
Mode. The Row Groups pane displays the hierarchical static and dynamic
members for the row groups hierarchy and the Column groups pane shows a similar
display for the column groups hierarchy.
3. Click the static member (row or column) that you want to remain visible
while scrolling. The Properties pane displays the Tablix Member properties.
4. In the Properties pane, set FixedData to True.
20. How to add Page Break
1. On the design surface, right-click the corner handle of the data region and
then click Tablix Properties.
2. On the General tab, under Page
break options, select one of the following options:
Add a page
break before:Select this option when you want to add a
page break before the table.
Add a page
break after:Select this option when you want to add a
page break after the table.
Fit table on
one page if possible:Select this
option when you want the data to stay on one page.
21. A main report contain subreport also. Can we export both main report and
subreport to Excel?
Yes. The exported report contains both the
mail report and sub report.
22. how to
convert PDF report from Portrait to Landscape format?
In Report Properties -->
Set the width of the report to the landscape
size of your A4 paper: 29.7 cm
Set the height of the report to 21 cm.
To avoid extra blank pages during export, the
size of the body should be less or equal to the size of the report - margins.
Set the width of the body to 26.7 cm (29.7
-1.5 - 1.5)
Set the height of the body to 18 cm (21 - 1.5
-1.5)
23. Error
handling in Report
Step 1: All
the data sets of the report should contain one addition input parameter which
should pass a unique information for every request (for every click of View
Report button) made by the user.
Step 2: Need to implement TRY CATCH blocks for all the Stored procedures
used in the SSRS reports through datasets. The CATCH section of every procedure
should have the provision to save the error details into DB table, if any error
occurred while execution of that procedure.
Step 3: Add one more additional dataset with the name
"ErrorInfo" which should call the store procedure (USP_ERROR_INFO).
This procedure should be accepting a unique value. This unique value should be
passed to all the data sets for every click of 'View Report' button made by the
user. This dataset will return the error information available in the data base
table by verifying records with the unique id which has passes as input
parameter.
Step 4:Enable the “Use Single Transaction When Processing Queries”
option in data source properties, which makes all the query executions through
a single transaction.
Step 5: After successful completion of all the above mentioned steps,
insert new table on SSRS report with custom error information which will be
shown to the report user if the user gets any error during execution of the report.
24. Have u
worked on any 3rd party Report Tools
There are few third party Report Tools like
Nevron, izenda.
25. Different
ways of Deploying reports
1. We can deploy the reports using rs.exe tool
2. In the Solution Explorer,
2.1.Right-click the report project, and then click Properties.
2.2.In the Property Pages dialog box for the project, select a configuration to
edit from the Configuration list. Common configurations are DebugLocal, Debug,
and Release.
2.3.In StartItem, select a report to display in the preview window
or in a browser window when the report project is run.
2.4.In the OverwriteDataSources list, select True to overwrite
the shared data source on the server each time shared data sources are
published, or select False to keep the data source on the server.
2.5.In the TargetDataSourceFolder text box, type the folder on
the report server in which to place the published shared data sources. The
default value for TargetDataSourceFolder is Data Sources. If you leave this
value blank, the data sources will be published to the location specified in
TargetReportFolder.
2.6. In the TargetReportFolder text box, type the folder on
the report server in which to place the published reports. The default value
for TargetReportFolder is the name of the report project.
2.7. In the TargetServerURL text box, type the URL of the
target report server. Before you publish a report, you must set this property
to a valid report server URL.

3. There are 2 options for deploying the reports that you create with Report
Builder 3.0:
1. Report Manager
2. SharePoint document library
26.
Difference between Cached Report and Snapshot Report
Cached Report is a saved copy of processed
report.
The first time a user clicks the link for a report configured to cache, the
report execution process is similar to the on-demand process. The intermediate
format is cached and stored in ReportServerTempDB Database until the cache
expiry time.
If a user request a different set of
parameter values for a cached report, then the report processor treats the
requests as a new report executing on demand, but flags it as a second cached
instance.
Report snapshot contains the Query and Layout
information retrieved at specific point of time. It executes the query and
produces the intermediate format. The intermediate format of the report has no
expiration time like a cached instance, and is stored in ReportServer Database.
27.
Subscription. Different types of Subscriptions?
Subscriptions are used to deliver the reports
to either File Share or Email in response to Report Level or Server Level
Schedule.
There are 2 types of subscriptions:
1. Standard Subscription: Static properties
are set for Report Delivery.
2. Data Driven Subscription: Dynamic Runtime
properties are set for Subscriptions
28. SSRS
Architecture
29. How to
deploy Reports from one server to other server
30. Different
life cycles of Report
1.Report authoring:
This stage involves creation of reports that
are published using the Report Definition language. RDL is an XML based industry
standard for defining reports.
Report Designer is a full-featured report
authoring tool that runs in Business Intelligence Development Studio and Report
Builder.
2. Report management:
This involves managing the published reports
as a part of the webservice. The reports are cached for consistency and
performance. They can be executed whenever demanded or can be scheduled and
executed.
In short Report Management includes:
- Organizing reports and data sources,
- Scheduling report execution and delivery
- Tracking reporting history.
3. Report delivery:
Reports can be delivered to the consumers
either on their demand or based on an event. Then they can view them is a
web-based format.
–Web based delivery via Report Manager web
site
–Subscriptions allow for automated report
delivery
–URL Access, Web Services and Report Viewer
control
4.Report security:
It is important to protect reports as well as
the report resources. Therefore, Reporting Services implement a flexible,
role-based security model.
31. Different
type of Reports
Linked report:A linked report is derived from an existing report and retains the
original's report definition. A linked report always inherits report layout and
data source properties of the original report. All other properties and settings
can be different from those of the original report, including security,
parameters, location, subscriptions, and schedules.
Snapshot
reports: A report snapshot contains layout
information and query results that were retrieved at a specific point in
time. Report snapshots are processed on a schedule and then saved to a report
server.
Subreport: A subreport is a report that displays another report inside the body
of a main report. The subreport can use different data sources than the
main report.
Cached
reports: A cached report is a saved copy of a
processed report. Cached reports are used to improve performance by
reducing the number of processing requests to the report processor and
by reducing the time required to retrieve large reports. They have a
mandatory expiration period, usually in minutes.
Drill Down
Report: Means navigate from the summary level
to detail level in the same report.
Drill Through Report: Navigation from one report to another report.
Ad hoc
reports:Ad Hoc reporting allows the end users to
design and create reports on their own provided the data models.
3 components: Report Builder, Report Model and Model Designer
Use 'Model Designer' tool to design 'Report Models' and then use 'Report Model'
tool to generate reports.
Report Builder
- Windows Winform application for End users to build ad-hoc reports with the
help of Report models.
32. Explain the Report Model Steps.
1. Create the report model project
select "Report Model Project" in the Templates list
A report model project contains the definition of the data source (.ds file),
the definition of a data source view (.dsv file), and the report model
(.smdl file).
2. Define a data source for the report model
3. Define a data source view for the report model
A data source view is a logical data model based on one or more data sources.
SQL Reporting Services generates the report model from the data source view.
4. Define a report model
5. Publish a report model to report server.
33. How to
get the data for Report Model Reports
Datasource View
34. Difference between RDL and RDLC?
RDL files are created for Sql Server Reporting Services and .RDLC files are for
Visual Studio Report Viewer Component.
The element of RDL contains query or command and is used by the
Report Server to connect to the datasources of the report.
The element is optional in RDLC file. This element is ignored by
Report Viewer control because Report Viewer control does not perform any data
processing in Local processing mode, but used data that the host application
supplies.
35.
Difference between Sorting and Interactive Sorting?
To control the Sort order of data in report, you must set the
sort expression on the data region or group. The does not have control over
sorting.
You can provide control to the user by adding Interactive Sort buttons
to toggle between ascending and descending order for rows in a table or
for rows and columns in a matrix. The most common use of interactive sort is to
add a sort button to every column header. The user can then choose which column
to sort by.
36. What is
Report Builder
Windows Winform application for End users to build ad-hoc reports with the help
of Report models.
37. Difference between Table report and
Matrix Report
A Table Report can have fixed number of columns and dynamic rows.
A Matrix Report has dynamic rows and dynamic columns.
38. When to use Table, Matrix and List
1. Use a Table to display detail data, organize the data in row groups, or
both.
2. Use a matrix to display aggregated data summaries, grouped in rows and
columns, similar to a PivotTable or crosstab. The number of rows and columns
for groups is determined by the number of unique values for each row and column
groups.
3. Use a list to create a free-form layout. You are not limited to a grid layout,
but can place fields freely inside the list. You can use a list to design a
form for displaying many dataset fields or as a container to display multiple
data regions side by side for grouped data. For example, you can define a group
for a list; add a table, chart, and image; and display values in table and
graphic form for each group value
39. Report Server Configuration Files
1. RSReportServer.config:
Stores configuration settings for feature areas of the Report Server service:
Report Manager, the Report Server Web service, and background
processing.
2. RSSrvPolicy.config
Stores the code access security policies for the server
extensions.
3. RSMgrPolicy.config
Stores the code access security policies for Report Manager.
4. Web.config for the Report Server Web service
Includes only those settings that are required for ASP.NET.
5. ReportingServicesService.exe.config
6. Registry settings
7. Web.config for Report Manager
Includes only those settings that are required for ASP.NET
8. RSReportDesigner.config
9. RSPreviewPolicy.config
40.
Difference between a Report and adhoc Report
Ad Hoc reporting allows the end users to design and create reports on their own
provided the data models.
Adhoc Report is created from existing report model using Report Builder.
41. How do u
secure a Report
1. Authorization is provided through a role-based security model that is
specific to Reporting Services.
Different Types of Roles provided by SSRS :
- Browsers
- Content Manager
- My Reports
- Publishers
- Report Builder
2. IIS security controls access to the report server virtual directory and
Report Manager.
42.How to
Combine Datasets in SSRS (1 Dataset gets data from Oracle and other dataset
from Sql Server)
Using LookUP function, we can combine 2
datasets in SSRS.
In the following example, assume that a table is bound to a dataset that
includes a field for the product identifier ProductID. A separate dataset
called "Product" contains the corresponding product identifier ID and
the product name Name.
=Lookup(Fields!ProductID.Value, Fields!ID.Value, Fields!Name.Value,
"Product")
In the above expression, Lookup compares the value of ProductID to ID in each
row of the dataset called "Product" and, when a match is found,
returns the value of the Name field for that row.
43. Difference between Report Server and Report Manager
Report Server handle authentication, data processing, rendering and
delivery operations.
The configuration settings of Report Manager and the Report Server Web service
are stored in a single configuration file (rsreportserver.config).
Report Manager is the web-based application included with Reporting
Services that handles all aspects of managing reports (deploying datasources
and reports, caching a report, subscriptions, snapshot).
44. Steps to repeat Table Headers in SSRS 2008?
1. Select the table
2. At the bottom of the screen, select a dropdown arrow beside column
groups. Enable "Advanced Mode" by clicking on it.
3. under Row Groups,select the static row and choose properties / press F4.
4. Set the following attributes for the static row or header row.
Set RepeatOnNewPage= True for repeating headers
Set KeepWithGroup= After
Set FixedData=True for keeping the headers visible.
45. How to
add assemblies in SSRS

45. Report Extensions?
46. parent grouping, child grouping in SSRS
47. How to show "No Data Found" Message to end user?
Add a Text box with expression =IIF(Count(,
"DataSet")=0,"No Data Returned", nothing)
and set the visibility of this Text box as =IIF(Count(,
"DataSet")=0,False,True)
48. What is
the 'Use single transaction when processing the queries' in the Datasource?
Dataset Execution Order?
By default, datasets are executed in parallel.
This option used to reduce the amount of open
connections to the database. For example, if you have a report with 3
datasets and you don’t have this option checked, a new connection is made to
the database for every single dataset. However, if you have it checked,
then only one connection will be open to the database and all the datasets will
return the data and the connection will be closed. This can be used to
reduce network traffic and potentially increase performance.
Open the data source dialog in report designer, and select the "Use
Single Transaction when processing the queries' check box. Once
selected, datasets that use the same data source are no longer executed in
parallel. They are also executed as a transaction, i.e. if any of the
queries fails to execute, the entire transaction is rolled back.
The order of the dataset execution sequence is determined by the top-down order
of the dataset appearance in the RDL file, which also corresponds to the order
shown in report designer.
49. ReportServer and ReportServerTempDB Databases
ReportServer: hosts the report catalog and metadata.
For eg: keeps the catalog items in the Catalog table, the data source
information in the Data-Source table of ReportServer Database.
ReportServerTempDB: used by RS for caching purposes.
For eg: once the report is executed, the Report Server saves a copy of the
report in the ReportServerTempDB database.

SSAS Interview Questions and Answers
1. Star Vs Snowflake schema and Dimensional modeling
Star Schema: One Fact Table surrounded by number of Dimension Tables. It
is a De-Normalized form.
Dimension table will not have any parent table.
Hierarchies in the Dimension are stored in the Dimension itself.
Snowflake: Normalized form of star schema is a snow flake schema.
Dimension tables can be further broken down into sub dimensions.
Dimension table will have one or more parent tables.
Hierarchies are broken into seperate tables in snow schema. These hierarchies
helps to drilldown the data from Top hierarchy to lowermost hierarchy.
Increases the number of joins and poor performance in retrival of data.
2. Data storage modes - MOLAP, ROLAP, HOLAP
In ROLAP, the structure of aggregation along with the values are stored in the 2
dimensional relational formats at disc level.
ROLAP offers low latency, but it requires large storage space as
well as slower processing and query response times.
In MOLAP, the structure of aggregation along with the data values are stored in
multi dimensional format, takes more space with less time for data analysis
compared to ROLAP.
MOLAPoffers faster query response and processing times, but
offers a high latency and requires average amount of storage space. This
storage mode leads to duplication of data as the detail data is present in both
the relational as well as the multidimensional storage.
In HOLAP, stucture is stored in Relational model and data is stored in multi
dimensional model which provides optimal usage and space.
This storage mode offers optimal storage space, query response time, latency
and fast processing times.
Default
storage setting is MOLAP.
3. Types of Dimensions
|
Dimension
type
|
Description
|
|
Regular
|
A dimension whose type has not been set to
a special dimension type.
|
|
Time
|
A dimension whose attributes represent time
periods, such as years, semesters, quarters, months, and days.
|
|
Organization
|
A dimension whose attributes represent
organizational information, such as employees or subsidiaries.
|
|
Geography
|
A dimension whose attributes represent
geographic information, such as cities or postal codes.
|
|
BillOfMaterials
|
A dimension whose attributes represent
inventory or manufacturing information, such as parts lists for products.
|
|
Accounts
|
A dimension whose attributes represent a
chart of accounts for financial reporting purposes.
|
|
Customers
|
A dimension whose attributes represent
customer or contact information.
|
|
Products
|
A dimension whose attributes represent
product information.
|
|
Scenario
|
A dimension whose attributes represent
planning or strategic analysis information.
|
|
Quantitative
|
A dimension whose attributes represent
quantitative information.
|
|
Utility
|
A dimension whose attributes represent
miscellaneous information.
|
|
Currency
|
This type of dimension contains currency
data and metadata.
|
|
Rates
|
A dimension whose attributes represent
currency rate information.
|
|
Channel
|
A dimension whose attributes represent
channel information.
|
|
Promotion
|
A dimension whose attributes represent
marketing promotion information.
|
|
|
4. Types of Measures
Fully Additive Facts: These are facts which can be added across all the
associated dimensions. For example, sales amount is a fact which can be summed
across different dimensions like customer, geography, date, product, and so on.
Semi-Additive Facts: These are facts which can be added across only few
dimensions rather than all dimensions. For example, bank balance is a fact
which can be summed across the customer dimension (i.e. the total balance of
all the customers in a bank at the end of a particular quarter). However,
the same fact cannot be added across the date dimension (i.e. the total balance
at the end of quarter 1 is $X million and $Y million at the end of quarter 2,
so at the end of quarter 2, the total balance is only $Y million and not
$X+$Y).
Non-Additive Facts: These are facts which cannot be added across any of
the dimensions in the cube. For example, profit margin is a fact which cannot
be added across any of the dimensions. For example, if product P1 has a 10%
profit and product P2 has a 10% profit then your net profit is still 10% and
not 20%. We cannot add profit margins across product dimensions.
Similarly, if your profit margin is 10% on Day1 and 10% on Day2, then your net
Profit Margin at the end of Day2 is still 10% and not 20%.
Derived Facts: Derived facts are the facts which are calculated from one
or more base facts, often by applying additional criteria. Often these are not
stored in the cube and are calculated on the fly at the time of accessing them.
For example, profit margin.
Factless Facts: A factless fact table is one which only has references
(Foreign Keys) to the dimensions and it does not contain any measures. These
types of fact tables are often used to capture events (valid transactions
without a net change in a measure value). For example, a balance enquiry at an
automated teller machine (ATM). Though there is no change in the account
balance, this transaction is still important for analysis purposes.
Textual Facts: Textual facts refer to the textual data present in the
fact table, which is not measurable (non-additive), but is important for
analysis purposes. For example, codes (i.e. product codes), flags (i.e. status
flag), etc.
5. Types of relationships between dimensions and measuregroups.
No relationship: The dimension and measure group are not related.
Regular: The dimension table is joined directly to the fact table.
Referenced: The dimension table is joined to an intermediate table,
which in turn,is joined to the fact table.
Many to many:The dimension table is to an intermediate fact table,the
intermediate fact table is joined, in turn, to an intermediate dimension table
to which the fact table is joined.
Data mining:The target dimension is based on a mining model built from
the source dimension. The source dimension must also be included in the cube.
Fact table: The dimension table is the fact table.
6. Proactive caching
Proactive caching can be configured to refresh the cache (MOLAP cache) either
on a pre-defined schedule or in response to an event (change in the data) from
the underlying relational database. Proactive caching settings also determine
whether the data is queried from the underlying relational database (ROLAP) or
is read from the outdated MOLAP cache, while the MOLAP cache is rebuilt.
Proactive caching helps in minimizing latency
and achieve high performance.
It enables a cube to reflect the most recent
data present in the underlying database by automatically refreshing the cube
based on the predefined settings.
Lazy aggregations:
When we reprocess SSAS cube then it actually
bring new/changed relational data into SSAS cube by reprocessing dimensions and
measures. Partition indexes and aggregations might be dropped due to changes in
related dimensions data so aggregations and partition indexes need to be
reprocessed. It might take more time to build aggregation and partition
indexes.
If you want to bring cube online sooner
without waiting rebuilding of partition indexes and aggregations then lazy
processing option can be chosen. Lazy processing option bring SSAS cube online
as soon as dimensions and measures get processed. Partition indexes and
aggregations are triggered later as a background job.
Lazy processing option can be changed by server level property "OLAP\LazyProcessing\Enabled"
Advantage: Lazy processing saves processing time as it brings as soon as measures
and dimension data is ready.
Disadvantage: User will see performance hit when
aggregation are getting build in background.
7. Partition
processing options
Process
Default: SSAS dynamically chooses from one of the
following process options.
Process Full: Drop all object stores, and rebuild the objects. This
option is when a structural change has been made to an object, for example,
when an
attribute hierarchy is added, deleted, or renamed.
Process Update: Forces a re-read of data and an update of dimension
attributes. Flexible aggregations and indexes on related partitions will be
dropped.
Process Add: For dimensions, adds new members and updates dimension attribute
captions and descriptions.
Process Data:Processes data only without building aggregations or
indexes. If there is data is in the partitions, it will be dropped before
re-populating the
partition with source data.
Process Index: Creates or rebuilds indexes and aggregations for
all processed partitions. For unprocessed objects, this option generates an
error.
Unprocess: Delete data from the object.
Process Structure: Drop the data and perform process default on all
dimensions.
Process Clear: Drops the data in the object specified and any
lower-level constituent objects. After the data is dropped, it is not reloaded.
Process Clear Structure: Removes all training data from a mining
structure.
8. Difference between attirubte hierarchy and user hierarchy
An Attribute Hierarchy is created by SSAS for every Attribute in a Dimension by
default. An Attribute by default contains only two levels - An "All"
level and a
"Detail" level which is nothing but the Dimension Members.
A User Defined Hierarchy is defined explicitly by the user/developer and often
contains multiple levels. For example, a Calendar Hierarchy contains
Year,
Quarter, Month, and Date as its levels.
Some of the highlights/differences of Attribute and User Defined Hierarchies:
1. Attribute Hierarchies are always Two-Level (Unless All Level is suppressed)
whereas User Defined Hierarchies are often Multi-Level.
2. By default, Every Attribute in a Dimension has an Attribute Hierarchy
whereas User Defined Hierarchies have to be explicitly defined by the
user/developer.
3. Every Dimension has at least one Attribute Hierarchy by default whereas
every Dimension does not necessarily contain a User Defined Hierarchy. In
essence, a Dimension can contain zero, one, or more User Defined
Hierarchies.
4. Attribute Hierarchies can be enabled or disabled. Disable the Attribute
Hierarchy for those attributes which are commonly not used to slice and dice
the data during analysis, like Address, Phone Number, and Unit Price etc. Doing
this will improve the cube processing performance and also reduces the size of
the cube as those attributes are not considered for performing aggregations.
5. Attribute Hierarchies can be made visible or hidden. When an Attribute
Hierarchy is hidden, it will not be visible to the client application while
browsing the Dimension/Cube. Attribute Hierarchies for those attributes which
are part of the User Defined Hierarchies, like Day, Month, Quarter, and Year,
which are part of the Calendar Hierarchy, can be hidden, since the attribute is
available to the end users through the User Defined Hierarchy and helps
eliminate the confusion/redundancy for end users.
9. Dimension, Hierarchy, Level, and Members
Dimensions in Analysis Services contain attributes that correspond
to columns in dimension tables. These attributes appear as attribute
hierarchies and can
be organized into user-defined hierarchies, or can be defined as parent-child
hierarchies based on columns in the underlying dimension table. Hierarchies are
used to organize measures that are contained in a cube.
Hierarchy: is the relation between attributes in a dimension.
Level: refers to individual attribute within the Hierarchy.
10. Difference between database dimension and cube dimension
When you create a dimension using dimension wizard in BIDS, then you're
creating a Database dimension in your AS database. Database dimensions is
independent of cube and can be processed on their own.
When you build a cube, and you add dimensions
to that cube, you create cube dimensions: cube dimensions are instances of a
database dimension inside a cube.
A database dimension can be used in multiple
cubes, and multiple cube dimensions can be based on a single database dimension
The Database dimension has only Name and ID
properties, whereas a Cube dimension has several more properties.
Database dimension is created one where as
Cube dimension is referenced from database dimension.
Database dimension exists only once.where as
Cube dimensions can be created more than one using ROLE PLAYING Dimensions
concept.
11.
Importance of CALCULATE keyword in MDX script, data pass and limiting cube
space
12. Effect of materialize
When setting up a dimension with a Refence relationship type, we have the
option of "materializing" the dimension.
Select to store the attribute member in the intermediate dimension
that links the attribute in the reference dimension to the fact table in the
MOLAP
structure. This imporvies the qery performance, but increases the
processing time and storage space.
If the option is not selected, only the relationship between the fact
records and the intermediate dimension is stored in the cube. This means that
Anaylysis services has to derive the aggregated values for the members of the
referenced dimension when a query is executed, resulting in slower query
performance.
13. Partition processing and Aggregation Usage Wizard
14. Perspectives, Translations, Linked Object Wizard
15. Handling late arriving dimensions / early arriving facts
16. Role playing Dimensions, Junk Dimensions, Conformed Dimensions, SCD and
other types of dimensions
Role playing Dimesnion:
A Role-Playing Dimension is a Dimension which
is connected to the same Fact Table multiple times using different Foreign
Keys.
eg: Consider a Time Dimension which is joined to the same Fact Table (Say
FactSales) multiple times, each time using a different Foreign Key in the
Fact
Table like Order Date, Due Date, Ship Date, Delivery Date, etc
Steps:
In Cube Designer, click the Dimension Usage
tab.
Either click the 'Add Cube Dimension' button,
or right-click anywhere on the work surface and then click Add Cube Dimension.
In the Add Cube Dimension dialog box, select
the dimension that you want to add, and then click OK.
A Conformed Dimension is
a Dimension which connects to multiple Fact Tables across one or more Data
Marts (cubes). Conformed Dimensions are exactly the same structure,
attributes, values (dimension members), meaning and definition.
Example: A Date Dimension has exactly the
same set of attributes, same members and same meaning irrespective of which
Fact Table it is connected to
A linked dimension is
based on a dimension that is stored in a separate Analysis Services
Database which may or may not be on the same server. You can create and
maintain a dimension in just one database and then reuse that dimension by
creating linked dimensions for use in multiple databases.
Linked Dimensions can be used when the exact same dimension can be used across
multiple Cubes within an Organization like a Time Dimension, gography
Dimension etc.
Here are some of the highlights of a Linked Dimension:
-More than one Linked Dimension can be created from a Single Database
Dimension.
-These can be used to implement the concept of Conformed Dimensions.
-For an end user, a Linked Dimension appears like any other Dimension.
A Degenerate Dimension is a Dimension which is derived out of
a Fact Table and it appears to the end user as a separate/distinct Dimension,
its data is
actually stored in the Fact Table. It's a Dimension table which does not have
an underlying physical table of its own.
Degenerate Dimensions are commonly used when the Fact Table contains/represents
Transactional data like Order Details, etc. and each Order has an Order Number
associated with it, which forms the unique value in the Degenerate Dimension.
A Junk Dimension is often a collection of Unrelated Attributes
like indicators, flags, codes, etc. It is also called as a Garbage Dimension.
Junk Dimensions are usually small in size.
One of the common scenarios is when a Fact Table contains a lot of Attributes
which are like indicators, flags, etc. Using Junk Dimensions, such Attributes
can be removed/cleaned up from a Fact Table.
SCD: The Slowly Changing Dimension (SCD) concept is basically about
how the data modifications are absorbed and maintained in a Dimension
Table.
The new (modified) record and the old record(s) are identified using some
kind of a flag like say IsActive, IsDeleted etc. or using Start and End Date
fields to indicate the validity of the record.
17. Parent Child Hierarchy, NamingTemplate property, MemberWithLeafLevelData
property
18. How will you keep measure in cube without showing it to user?
19. How to pass parameter in MDX
Here is an example, suppose this is your query:
select {[Measures].[Internet Order Quantity]} on 0,
[Product].[Category].[Category] on 1
from [Adventure Works]
where [Date].[Calendar Year].&[2002]
You can modify it like this:
select {[Measures].[Internet Order Quantity]} on 0,
[Product].[Category].[Category] on 1
from [Adventure Works]
where strtomember(@P1)
Now, if you pass the value [Date].[Calendar Year].&[2002] to the P1, then
it will run just like:
where [Date].[Calendar Year].&[2002]
STRTOSET returns a set.
STRTOMEMBER returns a member.
20. SSAS 2008 vs SSAS 2012
21. Dimension security vs Cell security
22. SCOPE statement, THIS keyword, SUBCUBE
23. CASE (CASE, WHEN, THEN, ELSE, END) statement, IF THEN END IF, IS keyword,
HAVING clause
24. CELL CALCULATION and CONDITION clause
25. RECURSION and FREEZE statement
26. Common types of errors encountered while processing a dimension / measure
groups / cube
27. Logging and monitoring MDX scripts and cube performance
28. What do
you understand by attribute relationship? what are the main advantages in using
attribute relationship?
An Attribute Relationship is a relationship
between various attributes within a Dimension. By default, every Attribute in a
Dimension is related to the Key
Attribute.
There are basically 2 types of Attribute Relationships: Rigid, Flexible
29. What is natural hierarchy and how will you create it?
Natural hierarchies, where each attribute is
related either directly or indirectly to all other attributes in the same
hierarchy, as in product category - product
subcategory - product name
30. What do
you understand by rigid and flexible relationship? Which one is better from
performance perspective?
Rigid: Attribute Relationship should be set to Rigid when the relationship
between those attributes is not going to change over time. For example,
relationship between a Month and a Date is
Rigid since a particular Date always belongs to a particular Month like 1st Feb
2012 always belongs to Feb
Month of 2012. Try to set the relationship to
Rigid wherever possible.
Flexible: Attribute Relationship should be set to Flexible when the relationship
between those attributes is going to change over time. For example,
relationship between an Employee and a Manager is Flexible since a particular
Employee might work under one manager during this year (time period) and under
a different manager during next year (another time period).
31. In which
scenario, you would like to go for materializing dimension?
Reference dimensions let you create a
relationship between a measure group and a dimension using an intermediate
dimension to act as a bridge between
them.
32. In dimension usage tab, how many
types of joins are possible to form relationship between measure group and
dimension?
33. What
is deploy, process and build?
Bulid: Verifies the project files and create
several local files.
Deploy: Deploy the structure of the cube(Skeleton) to the server.
Process: Read the data from the source and build the dimesions and cube
structures
34. Can you
create server time dimension in analysis services(Server time dimension)?
35. How many
types of dimension are possible in SSAS?
Account
Bill of Materials
Currency
Channel
Customer
Geography
Organizations
Products
promotion
Regular
Scenario
Time
Unary
36. What is
time intelligence? How will you implement in SSAS?
37. What do
you understand by linked cube or linked object feature in SSAS?
38. How will
you write back to dimension using excel or any other client tool?
39. What do
you understand by dynamic named set (SSAS 2008)? How is i different from static
named set?
40. In
Process Update, which relationship will be better(Rigid and Flexible
relationship)?
41. What is
the difference between "ProcessingGroup" ByAttribute and
ByTable?
42. What do
you understand by following properties of dimension attribute.
Default Member
AttributeHierarchyEnabled
AttributeHierarchyOptimizedState
DiscretizationMethod
OrderBy
OrderByAttribute
43.
What are different storage mode option in SQL server analysis services
and which scenario, they will be useful?
44. How
will you implement data security for given scenario in analysis service data?
"I have
4 cubes and 20 dimension. I need to give access to CEO, Operation managers and
Sales managers and employee.
1) CEO can
see all the data of all 4 cubes.
2) Operation Managers
can see only data related to their cube. There are four operation managers.
3) Employees
can see only certain dimension and measure groups data. (200 Employees) "
45. What are
the options to deploy SSAS cube in production?
Right click on Project in Solution Explorer
-> Properties
Build -> Select ' Output Path'
Deployment ->
Processing Option - Default, Full, Do
Not Process
Transactional Deployment - False, True
Deployment Mode - Deploy All, Deploy
Changes only
1.BIDS
In BIDS from the build menu – select the build option (or right click on the
project in the solution explorer).
The build process will create four xml files in the bin subfolder of the
project folder
.asdatabase - is the main object definition file
.configsettings
.deploymentoptions
.deploymenttargets
2. Deploy
Deployment via BIDS will overwrite the destination database management settings
– so is not recommended for production deployment.
A more controllable option is the Deployment wizard, available in interactive
or command line mode.
Run the wizard from Start -> All Programs ->Microsoft Sql Server ->
Analysis Services -> deployment wizard
1. Browse to the .asdatabase file created by the build
2. connect to the target server
3. Configure how partitions and roles should be deployed
4. specify how configuration settings are deployed
5. Specify Processing options:
Default processing allows SSAS to decide what needs to be done; Full processing
can be used to process all objects. You can also choose not to process
at all.
6. choose whether to deploy instantly or to create an XMLA command script for
later deployment. The script will be created in the same location as the
.asdatabase file.
46. What are
the options available to incrementally load relational data into SSAS cube?
Use Slowly Changing Dimesnion
47. Why will
you use aggregation at remote server?
48.
What are different ways to create aggregations in SSAS?
49. What do
you understand by Usage based optimization?
50. Can
we use different aggregation scheme for different partitions?
51. Why will
you use perspective in SSAS?
52. What are
KPIs? How will you create KPIs in SSAS?
53. What are
the main feature differences in SSAS 2005 and SSAS 2008 from developer point of
view?
54.What are
the aggregate functions available for measure in SSAS?
Sum, Min, Max, Count, and Distinct Count
55. What are
the processing modes available for measure group? What do you understand by
lazy aggregation?
56. How can
you improve dimension design?
1: Limit the Number of Dimensions Per Measure
Group and Number of Attributes Per Dimension.
AttributeHierarchyOptimizedState: Determines the level of optimization applied
to the attribute hierarchy. By default, an attribute hierarchy is
FullyOptimized, which means that Analysis Services builds indexes for the
attribute hierarchy to improve query performance. The other option,
NotOptimized, means that no indexes are built for the attribute
hierarchy.
2: Use Dimension Properties Effectively
For large dimensions that expose millions of rows and have a large number of
attributes, pay particular attention to the ProcessingGroup property. By
default, this property is assigned a value of ByAttribute.
3: Use Regular Dimension Relationship Whenever Possible
4: Use Integer Data Type for Attribute Keys If at All Possible
5: Use Natural Hierarchies When Possible
57. What are
the performance issues with parent child hierarchy?
In parent-child hierarchies, aggregations are
created only for the key attribute and the top attribute, i.e., the All
attribute unless it is disabled.
58. What do
you understand by formula engine and storage engine?
Formula Engine is single-threaded, Storage
Engine (SE) is multi-threaded.
The Query Processor Cache/Formula Engine Cache caches the calculation results
whereas the Storage Engine Cache caches aggregated/fact data being
queried.
59. How can
you improve overall cube performance?
1. Partitioning the cube can help to reduce the processing time. The
benefit of partitioning is that it allows to process multiple partitions
in parallel on a
server that has multiple processors.
2. Keep Cube space as small as possible by only including measures groups that
are needed.
3. Place the measures that are queried together in same measure group. A query
that retrieves measures from multiple measure groups requires multiple storage
space.
4. Define the aggregations to reduce the number of records that the storage
engine needs to scan from disk to satisfy a query.
5. Avoid designing excessive aggregations. Excessive aggregations may reduce
processing performance and query performance.
Regarding the best possible processing strategy, the following steps:
1. Process Update all the dimensions that could have had data changed.
Depending on the nature of the changes in the dimension table, Process
Update can affect dependent partitions. If only new members were added,
then the partitions are not affected. But if members were deleted or if
member relationships changed, then some of the aggregation data and bitmap
indexes on the partitions are dropped.
2. Process Data the partitions that have changed data (which are usually the
most recent partitions). Of course, the smaller the partition, the
better, so try to use daily partitions instead of monthly or use monthly
partitions instead of yearly.
3. Process Index for the rest of the partitions
MDX
1. Explain
the structure of MDX query?
2. MDX functions?
MDX KPI Functions:
KPICurrentTimeMember, KPIGoal, KPIStatus, KPITrend
KPIValue, KPIWeight
MDX Metadata Functions:
Axis, Count (Dimension), Count (Hierarchy Levels), Count (Tuple)
Hierarchy, Level, Levels, Name,Ordinal, UniqueName
MDX Navigation Functions:
Ancestor, Ancestors, Ascendants, Children
Cousin, Current, CurrentMember, CurrentOrdinal
DataMember, DefaultMember, FirstChild, FirstSibling
IsAncestor, IsGeneration, IsLeaf, IsSibling
Lag, LastChild, LastSibling, Lead
LinkMember, LookupCube, NextMember, Parent
PrevMember, Properties, Siblings, UnknownMember
MDX Other Functions:
CalculationCurrentPass, CalculationPassValue, CustomData, Dimension
Dimensions, Error, Item (Member), Item (Set)
Members (String), Predict, SetToArray
MDX Set Functions:
AddCalculatedMembers, AllMembers, BottomCount, BottomPercent
BottomSum, Crossjoin, Descendants, Distinct
Except, Exists, Extract, Filter
Generate, Head, Hierarchize, Intersect
MeasureGroupMeasures, Members (Set), NonEmpty, NonEmptyCrossjoin
Order, StripCalculatedMembers, Subset, Tail
TopCount, TopPercent, TopSum, Union
Unorder
MDX Statistical Functions:
Aggregate, Avg, CoalesceEmpty, Correlation
Count (Set), Covariance, CovarianceN, DistinctCount
LinRegIntercept, LinRegPoint, LinRegR2, LinRegSlope
LinRegVariance, Max, Median, Min
Rank, RollupChildren, Stdev, StdevP
Sum, Var, VarP, VisualTotals
MDX String Functions:
MemberToStr, NameToSet, Root, SetToStr
StrToMember, StrToSet, StrToTuple, StrToValue,TupleToStr, UserName
MDX SubCube Functions:
Leaves, This
MDX Time Functions:
ClosingPeriod, LastPeriods, Mtd, OpeningPeriod
ParallelPeriod, PeriodsToDate, Qtd, Wtd,Ytd
MDX UI Functions:
DrilldownLevel, DrilldownLevelBottom, DrilldownLevelTop, DrilldownMember
DrilldownMemberBottom, DrilldownMemberTop, DrillupLevel, DrillupMember
ToggleDrillState
MDX Value Functions:
IIf, IsEmpty, MemberValue, ValidMeasure, Value
3. What is the difference between set and tuple?
Tuple: It is a collection of members from different Dimension
Set: collection of one or More tuples from same dimension
4. What do you understand by Named set?
Named sets are simply MDX expression that return a set of members.
To define a named set:
CREATE SET MySet AS SomeSetExpression
or you can use
WITH SET MySet AS SomeSetExpression
The different between the two is the scope. Using WITH specifies the scope of
the named set as the query, so as soon as the query finishes executing, that
named set is gone. Using CREATE, the scope of the query is limited to the MDX
session as long as you don't drop the set.
When defining your named set, you also have the option to specify when the
named set is evaluated using DYNAMIC or STATIC, as seen here:
CREATE DYNAMIC SET MySet AS SomeSetExpression
or
CREATE STATIC SET MySet AS SomeSetExpression
A Dynamic Named Set respects the context of a query's subcube
and the query's WHERE clause and is evaluated at the time the query is
executed.
A Static Named Set is evaluated at the time the cube is
processed and will not respect any subcube context and slicers in WHERE
clause.
Example 1:
CREATE SET DateRange AS
[Date].[Calendar Year].&[2001] : [Date].[Calendar Year].&[2004]
SELECT [Measures].[Reseller Sales Amount] ON COLUMNS,
DateRange ON ROWS
FROM [Adventure Works]
Example 2:
WITH SET SouthEastUS AS
{[Geography].[State-Province].&[AL]&[US],
[Geography].[State-Province].&[FL]&[US],
[Geography].[State-Province].&[GA]&[US],
[Geography].[State-Province].&[SC]&[US]}
SELECT [Measures].[Reseller Sales Amount] ON COLUMNS,
SouthEastUS ON ROWS
FROM [Adventure Works]
5. How will you differentiate among level, member, attribute, hierarchy?
6. What are the differences among exists, existing and scope?
7. What will happen if we remove CALCULATE keyword in the script?
8. How will you pass parameter in MDX?
9. What is the difference between .MEMBERS and .CHILDREN?
10.What is the difference between NON EMPTY keyword and NONEMPTY() function?
NON EMPTY:
Non Empty is prefixed before the sets defining the axes and is used for
removing NULLs.
In short, only the rows having NULL for all the members of the set
defined in the column axis is filtered out. This is because the Non Empty
operator works on the top level of the query. Internally, the sets defined for
the axes are generated first and then the tuples having NULL values are
removed.
SELECT
NON EMPTY
{
[Measures].[Hits]
,[Measures].[Subscribers]
,[Measures].[Spam]
} ON COLUMNS
,{
[Geography].[Country].Children
} ON ROWS
FROM [Blog Statistics];
NONEMPTY():
The NonEmpty() returns the set of tuples that are not empty from a specified
set, based on the cross product of the specified set with a second set. Suppose
we want to see all the measures related to countries which have a non-null
value for Subscribers
SELECT
{
[Measures].[Hits]
,[Measures].[Subscribers]
,[Measures].[Spam]
} ON COLUMNS
,{
NonEmpty
(
[Geography].[Country].Children
,[Measures].[Subscribers]
)
} ON ROWS
FROM [Blog Statistics];
11. Functions used commonly in MDX like Filter, Descendants, BAsc and others
12. Difference between NON EMPTY keyword and function, NON_EMPTY_BEHAVIOR,
ParallelPeriod, AUTOEXISTS
13. Difference between static and dynamic set
CREATE DYNAMIC SET MySet AS SomeSetExpression
or
CREATE STATIC SET MySet AS SomeSetExpression
A respects the context of a query's subcube and the query's WHERE
clause and is evaluated at the time the query is executed.
A Static Named Set is evaluated at the time the cube is processed and will not
respect any subcube context and slicers in WHERE clause.
14. Difference between natural and unnatural hierarchy, attribute
relationships
15. Difference between rigid and flexible relationships
16. Write MDX for retrieving top 3 customers based on internet sales
amount?
17. Write MDX to find current month's start and end date?
18. Write MDX to compare current month's revenue with last year same month
revenue?
19. Write MDX to find MTD(month to date), QTD(quarter to date) and YTD(year to
date) internet sales amount for top 5 products?
20. Write MDX to find count of regions for each country?
21. Write MDX to rank all the product category based on calendar year 2005
internet sales amount?
22. Write MDX to extract nth position tuple from specific set?
syntax:
Index syntax:
Set_Expression.Item(Index)
String expression syntax:
Set_Expression.Item(String_Expression1 [ ,String_Expression2,...n])
The following example returns ([1996],Sales):
{([1996],Sales), ([1997],Sales), ([1998],Sales)}.Item(0)
23. Write MDX to set default member for particular dimension?
24. What are the performance consideration for improving MDX queries?
25. Is Rank MDX function performance intensive?
26. Which one is better from performance point of view...NON Empty
keyword or NONEMPTY function?
27. How will you find performance bottleneck in any given MDX?
28. What do you understand by storage engine and formula engine?
SSIS Basic Interview Questions
1.
What are the different types of Data flow components in SSIS?
There
are 3 data flow components in SSIS.
1. Sources
2. Transformations
3. Destinations
2. Explain Audit Transformation ?
It
allows you to add auditing information as required in auditing world specified
by HIPPA and Sarbanes-Oxley (SOX). Auditing options that you can add to
transformed data through this transformation are :
1. Execution of Instance GUID : ID of execution instance of the package
2. PackageID : ID of the package
3. PackageName
4.VersionID : GUID version of the package
5. Execution StartTime
6.MachineName
7.UserName
8.TaskName
9.TaskID : uniqueidentifier type of the data flow task that contains audit
transformation
3.
Explain Copy column Transformation?
This
component simply copies a column to another new column. Just like ALIAS Column
in T-Sql.
4.
Explain Derived column Transformation?
Derived
column creates new column or put manipulation of several columns into new
column. You can directly copy existing or create a new column using more than
one column also.
5.Explain
Multicast Transformation?
This
transformation sends output to multiple output paths with no conditional as
Conditional Split does. Takes ONE Input and makes the COPY of data and passes
the same data through many outputs. In simple Give one input and take many
outputs of the same data.
6.What is a
Task?
A task
is very much like a method of any programming language which represents or
carries out an individual unit of work. There are broadly two categories of
tasks in SSIS, Control Flow tasks and Database Maintenance tasks. All Control
Flow tasks are operational in nature except Data Flow tasks. Although there are
around 30 control flow tasks which you can use in your package you can also
develop your own custom tasks with your choice of .NET programming language
7.What is a
workflow in SSIS ?
Workflow
is a set of instructions on to specify the Program Executor on how to execute
tasks and containers within SSIS Packages
8.What is the
Control Flow?
When you start working with SSIS, you first
create a package which is nothing but a collection of tasks or package
components. The control flow allows you to order the workflow, so you can
ensure tasks/components get executed in the appropriate order
9.What is a
Transformation?
A transformation simply means bringing in the
data in a desired format. For example you are pulling data from the source and
want to ensure only distinct records are written to the destination, so
duplicates are removed. Anther example is if you have
master/reference data and want to pull only related data from the source and
hence you need some sort of lookup. There are around 30 transformation tasks
available and this can be extended further with custom built tasks if needed.
10.How many difference source and
destinations have you used?
It is very common to get all kinds of sources so the
more the person worked with the better for you. Common ones are SQL Server,
CSV/TXT, Flat Files, Excel, Access, Oracle, MySQL but also Salesforce, web data
scrapping.